[Visual Studio] Performance, performance, performance (with the help of Visual Studio “PerfTips”)
For Visual Studio 2015
For as long as anyone can remember, when debugging with Visual Studio almost everyone knows to poke the mouse at some variable so a small panel shows up displaying all of that variable’s data. This post shows you how to use Visual Studio 2015’s new tools to improve your app’s performance.
1. Why performance?
Visual Studio 2015 has quite a few tools to help you improve your app’s performance, make it run faster, use less memory, look nicer, blah blah blah. However, a lot of young developers spend most of their time making the app’s features work the way they want. You know the code you wrote doesn’t perform well, but you have no time to study it, chew it over, or run the performance analysis tools until performance becomes a big problem for you.
On top of that, when you do need to study some code’s performance, despite Visual Studio’s terrifying power you end up stuffing a Stopwatch into your code to measure how long that code takes. In short, developers usually do the following:
- Insert code into the app (like System.Diagnostics.Stopwatch) to measure run time. More and more Stopwatches get inserted over and over in many parts of the code.
- Debug line by line to see whether some line “takes too long”
- Hit “Break All” (“Pause”) to see how far the code has gotten (especially inside loops)
- Shorten code too aggressively without paying attention to performance (like using Linq for absolutely everything)
2. What is PerfTips?
When you set a breakpoint on some line of code and the app runs to that breakpoint, Visual Studio shows a small, faded piece of text right at the end of the line — that is PerfTips
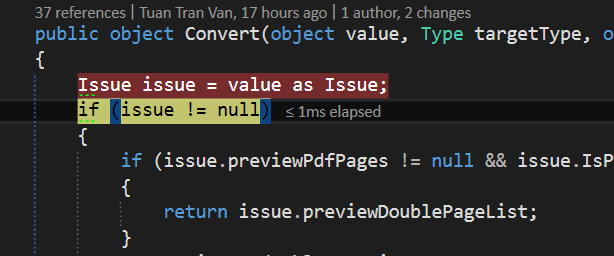
Click it (the <= 1ms elapsed part) and the analysis tool shows up
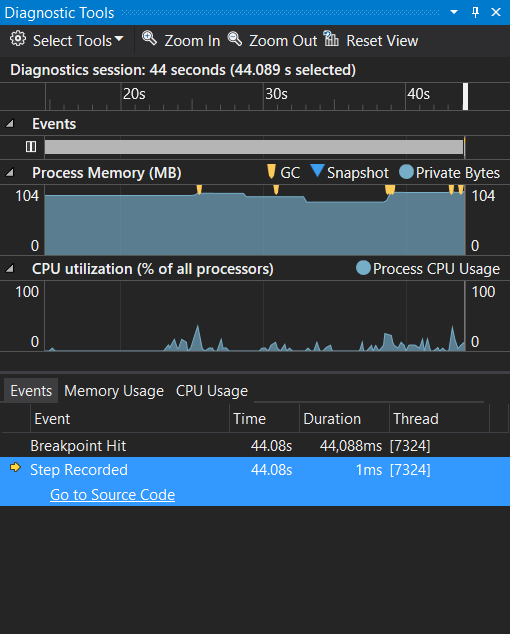
3. Using PerfTips
We’ll use a simple sample, a piece of code that loads images
Instead of inserting 2 Stopwatch snippets at the start and the end of this method, you just put 2 breakpoints there

Hit F5 to run, and Visual Studio stops right at the first Breakpoint
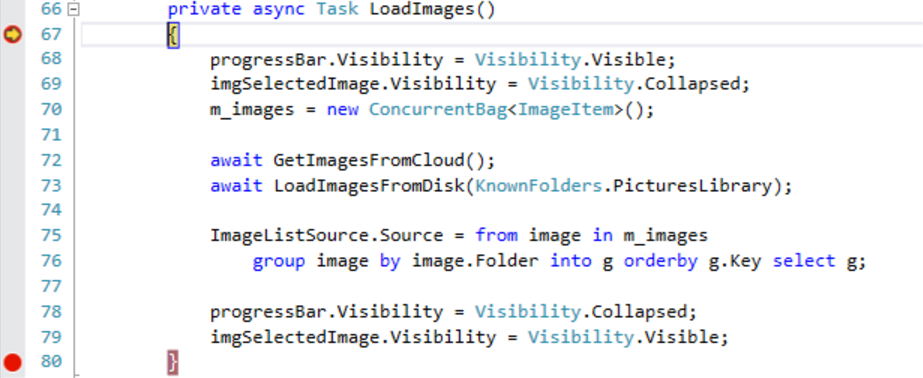
Hit F5 (or continue) to let Visual Studio run to the 2nd breakpoint, and you’ll see PerfTips show up

So we can see the LoadImages method took 2780 milliseconds. Now run the whole thing again, but stop at each line of code to see which line eats the most time.
Hit F10 to step line by line. For the first few lines, none takes more than 20 ms — excellent.

But the GetImageFromCloud line takes up to 1391 ms

And the LoadImagesFromDisk line takes up to 1361 ms

So why don’t we let these 2 methods run in parallel?
Change the code to this
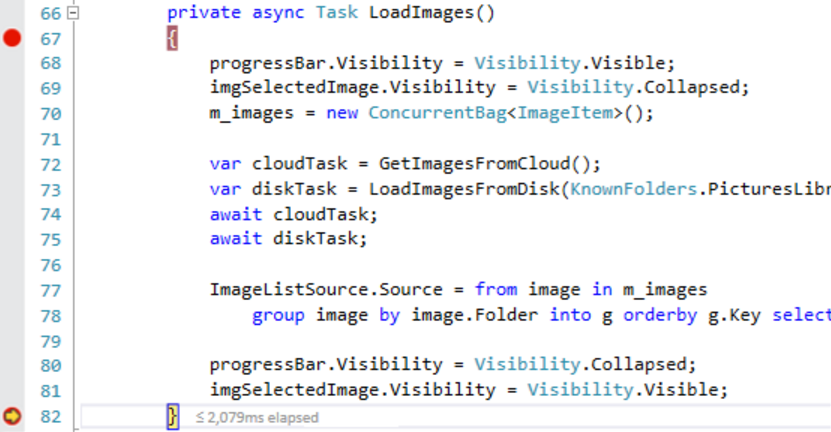
In the picture above you can see the whole LoadImages method takes 2079 ms, about 700 ms less, roughly 25%. Great, isn’t it?
Now that you know how to use PerfTips, let’s continue with a few Best Practices for using it
4. Best Practices
4.1. Measure several times
Run time and code performance can differ from run to run. Usually a piece of code is always slower the first time than on the 2nd, 3rd, nth run. The reason is that on the first run it has to load the dlls and warm up the caches. Measuring several times gives you a more accurate figure
4.2. Confirm it in Release
Code built in Debug mode always runs noticeably slower than code built in Release mode. If you want to optimize code that already runs faster than 50 ms, switch to release mode to optimize it. Only then does the difference become clear.
That’s it. See you in the next blog posts.