[Visual Studio] Fighting with Bugs and Exceptions
Programming in Visual Studio, sooner or later everyone runs into bugs and Exceptions. For some exceptions Visual Studio highlights the code that caused the exception in yellow, but for other exceptions Visual Studio jumps somewhere else entirely. Why? Why won’t it tell me where the broken code is.
Visual Studio 2015 has a valuable improvement that lets developers know exactly where the exception happened, plus several other extremely valuable improvements when debugging code
1. Advanced Debugging
Everybody knows that to debug some code you usually set a break point. When the code runs there, it stops right at that Breakpoint. The end. Roll credits. However, if you read this blog post: [Visual Studio] Performance, performance, performance (with the help of Visual Studio “PerfTips”), you’ll see another use of the Breakpoint: measuring how long a piece of code takes to run. Breakpoints have a few other uses too
1.1. Output Log with Breakpoint
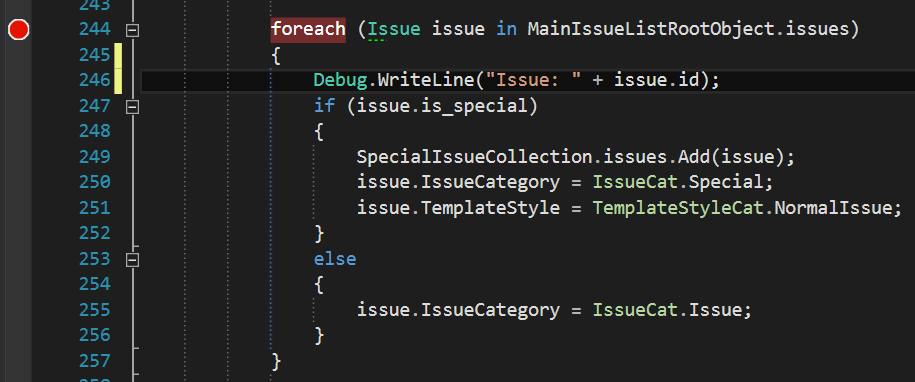
In the loop above you’ll see a “Debug.WriteLine” line used to print some information to the Output window. This information tells you the code reached this line, and prints the values you wanted.
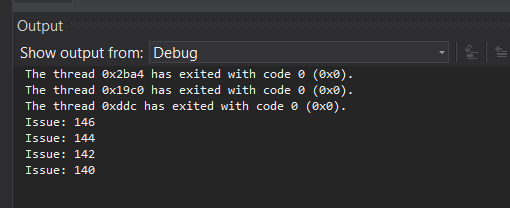
From now on you don’t have to do it by hand like that anymore.
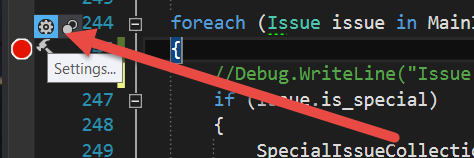
Move the mouse near the Breakpoint and a tiny menu shows up; click the gear icon
A window shows up, wedged into the middle of the code where your breakpoint is. Tick the Action box. You’ll see the “Log a message to output Windows” feature
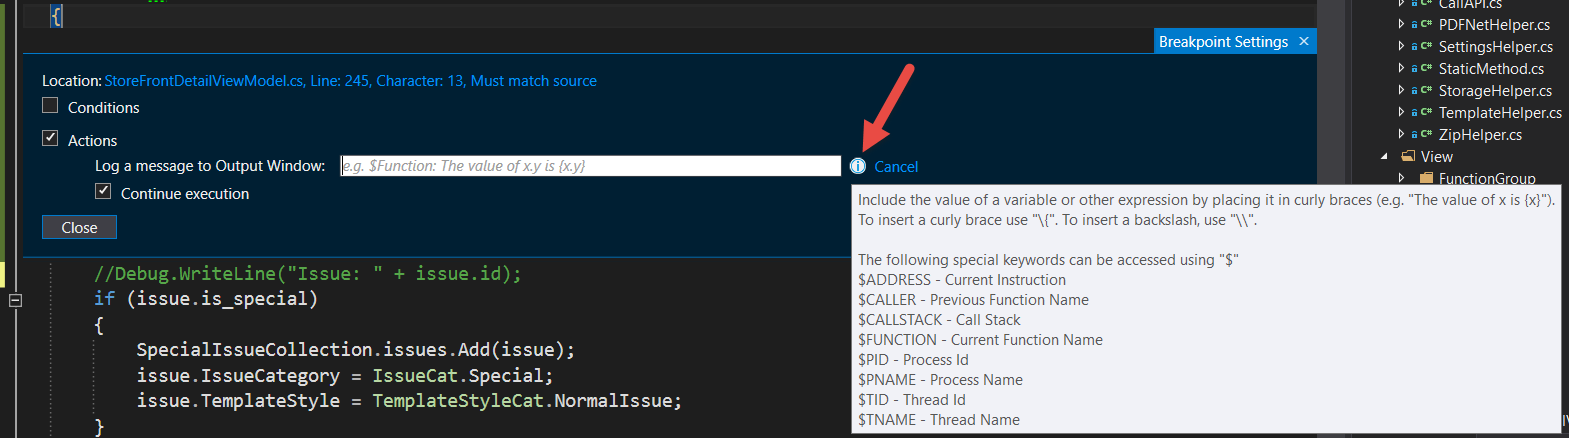
Type into that box whatever you want printed to the output window. Variables go in curly braces. That’s it
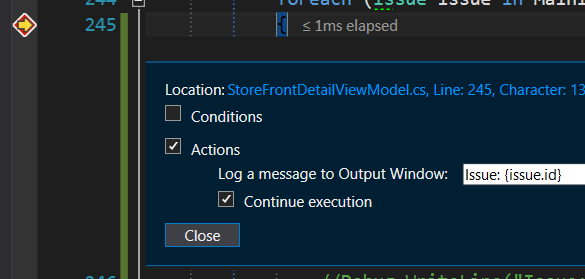
When you run the app again, the output window shows
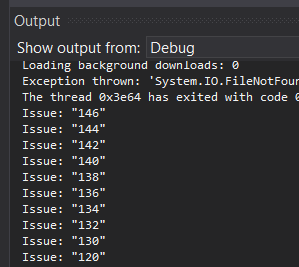
The number appears in quotes because it is a string, not an int. So when displaying it, Visual Studio puts it in quotes
Now let’s compare a bit
| Breakpoint “Action” | Debug.WriteLine() | |
|---|---|---|
| Pros | Fast and simple Doesn’t change the code Can be edited while the app is running Can be combined with the Breakpoint’s Condition Can be managed centrally in the Debug window |
Flexible to use Visual and easy to understand Can print many lines |
| Cons | Can only print 1 line (I haven’t found a way to break lines) | You have to change the code Can’t be edited while the app is running Use Debug.WriteLineIf() to add a condition To find them you have to use Ctrl + F and search for the phrase as usual Costs performance (negligible, and no impact in Release) |
1.2. Condition Breakpoint
Now also tick the Condition box, and the window expands to reveal more options for you
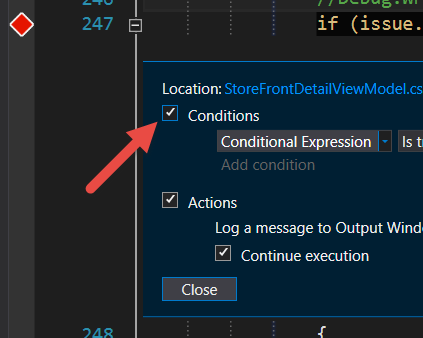
You have many options to decide whether Visual Studio stops at this Breakpoint. Among them are
Conditional Expression: stops at the breakpoint when the condition is true
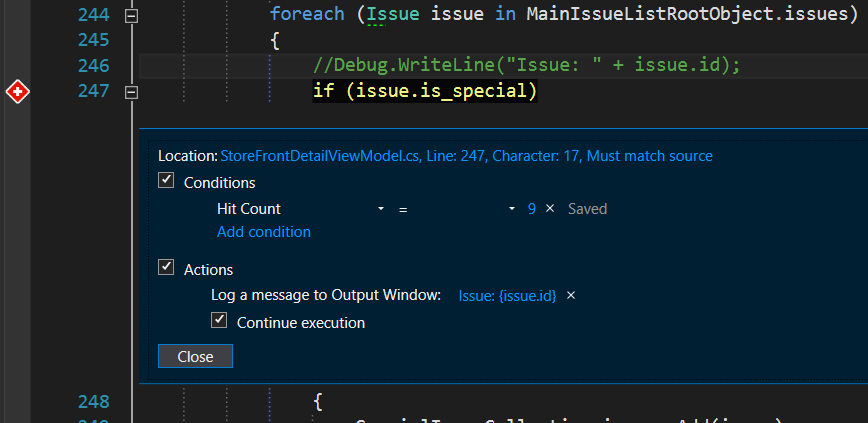
Hit Count: every time the code runs past this breakpoint, Visual Studio counts a hit. When it reaches the hit count you set, it stops.
Filter: stops at the Breakpoint when some special conditions are met (for example MachineName, ProcessId, and so on)
For Windows Apps you’ll use the first two the most
Say I want to stop on the 9th run and print the variable on that run — the setup is:
2. The new Exception Settings
Have you ever hit an error on some completely unfamiliar line like this?
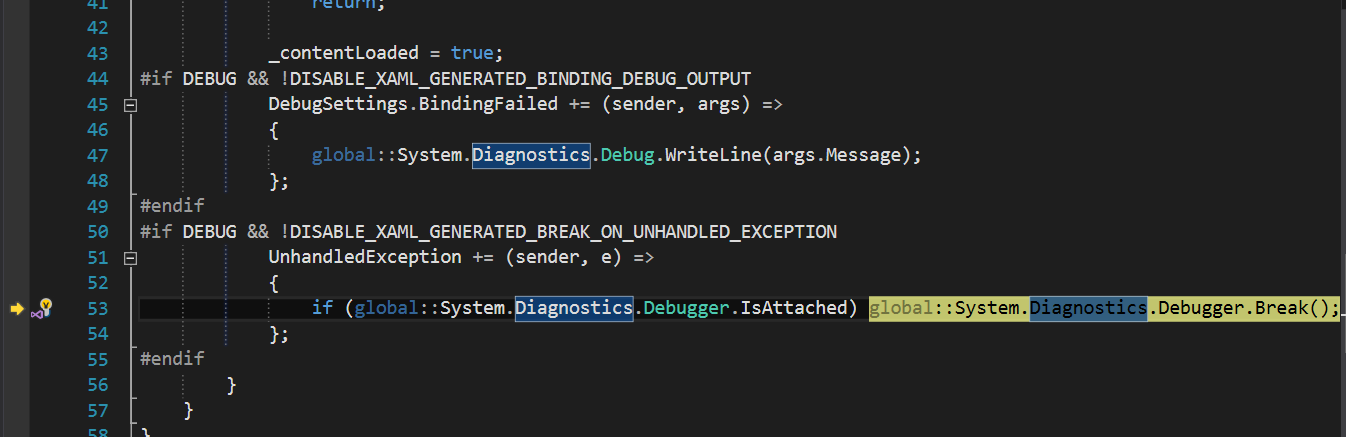
DISABLE_XAML_BREAK_ON_UNHANDLED_EXCEPTION
Global::System.Diagnostics.Debugger.Break();
What is this
Or an error like this
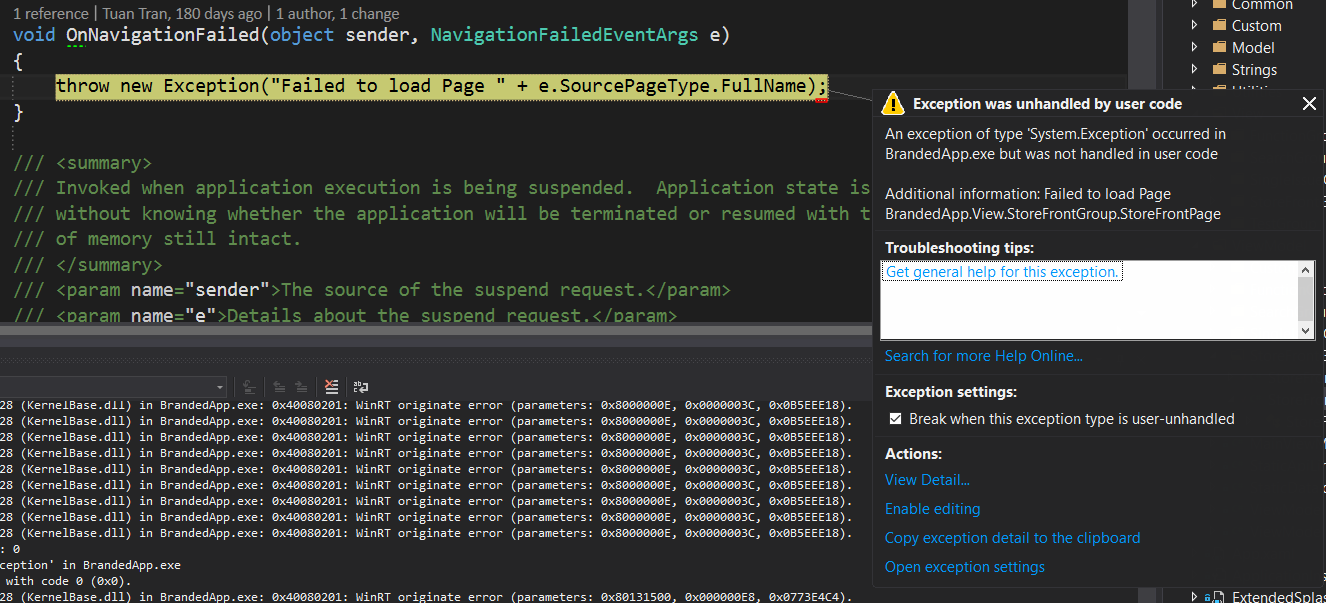
“An exception of type “Blah blah blah” occurred in Yourappname.exe but was not handled in user code”, and along with it Visual Studio stops on some unfamiliar line, and you know for sure the error happened somewhere else, not on this line.
That is why we use Exception Settings to jump to the exact code that raised the error
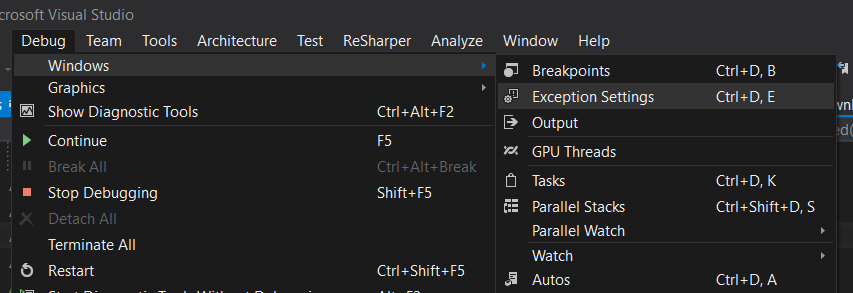
Go to Debug > Windows > Exception Settings…
Copy the Exception’s name — in the case above, “System.Exception” — and paste it into the search box. Tick the result that shows up
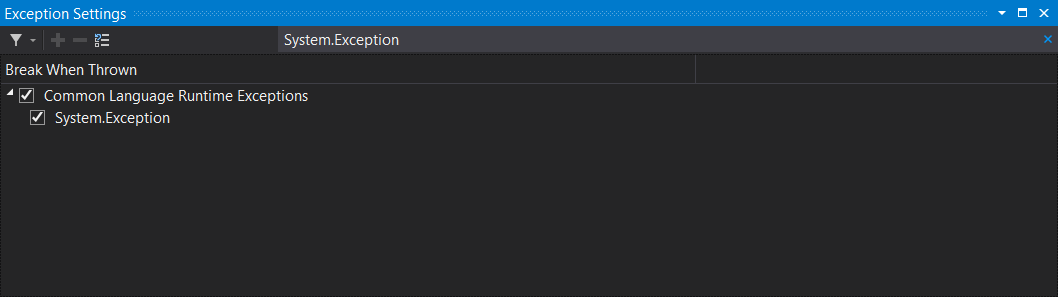
Run the app again. And now Visual Studio jumps to the exact broken line
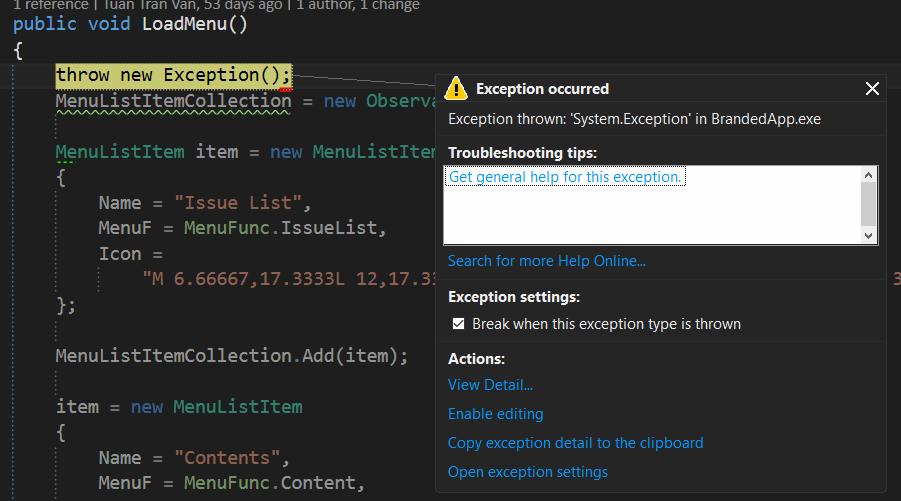
Great, isn’t it
Stay tuned for the next blog posts about Visual Studio’s extremely cute features.